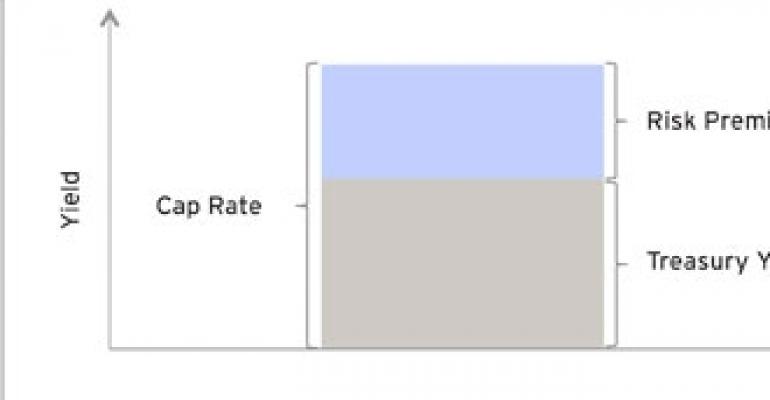
The cap rate spread over the 10-year Treasury yield is normally positive, reflecting the additional risks inherent in real estate assets (Exhibit 1). The risk premium is generally considered necessary to compensate for liquidity, leasing and tenant credit risk.
This risk premium component fluctuates depending on the outlook for the commercial real estate market. We believe this spread can serve as a rough gauge of the relative value of the real estate market.

When projected future income growth is strong, asset values will likely appreciate and the risk premium will decrease. As a result, the cap rate spread over the Treasury yield may fall below the long-term average.
For example, in 2005 and 2006 cap rates for several large office sales in Manhattan were reported to be less than 4%, well below the 10-year Treasury yield of about 5% at that time. Such low cap rates were justified at the time by expectations of significant income growth — often double-digit growth — in future years. Unfortunately, those aggressive assumptions did not materialize as the economy went into a severe recession in 2008 and 2009.
Conversely, when projected future income growth is weak, the risk premium will likely increase and the cap rate spread over Treasuries rises above the long-term average. Today, rents in most markets across the country are falling and asset values are depreciating. The risk premium is high.
As illustrated in Exhibit 2, the long-term average spread between the cap rate and the 10-Year Treasury yield since 2001 has been 320 basis points (the dotted line). We believe that persistently high cap rate spreads above the mean may indicate that markets are oversold, while persistently low cap rates — especially negative spreads to Treasuries — may indicate that markets are overbought.
As of the second quarter of 2009, the cap rate spread (the light blue line) has widened to more than 400 basis points. We believe this trend reflects increased risk-aversion among investors, who are pricing in a negative outlook for real estate.
During the recession of the early 2000s, cap rate spreads also rose to more than 400 basis points, making real estate appear undervalued relative to Treasuries. We believe that entering the real estate market during such periods of above-average spreads may be advantageous to long-term investors.
These periods of high cap rates and spreads often do not last long. From 2003 to 2007, spreads narrowed significantly as the economy recovered and property values appreciated (Exhibit 2).

Cap rates and spreads began to widen again in late 2007. According to Real Capital Analytics, as of the second quarter of 2009 cap rates for market transactions ranged from 7% to 8.5% depending on the property type (Exhibit 3). From the peak of the market until June 30, 2009, cap rates increased by 120 to 300 basis points, with the CBD office market expanding the most.

We caution that in today’s environment low transaction volume and incomplete data make tracking cap rates extremely challenging. Nonetheless, the current spread between cap rates and the 10-year Treasury yield suggests that commercial real estate may be undervalued, or oversold, relative to historical standards. We expect these spreads to remain elevated for some time given the uncertainty in the economy and the risk of additional distress — they may even widen further.
As the economy begins to rebound and real estate fundamentals improve, investors will likely become less risk-averse. We believe it is likely that more capital will flow into the sector in 2010. Consequently, we expect cap rate spreads to eventually narrow gradually, reverting toward the mean, and repeating the cycle.