
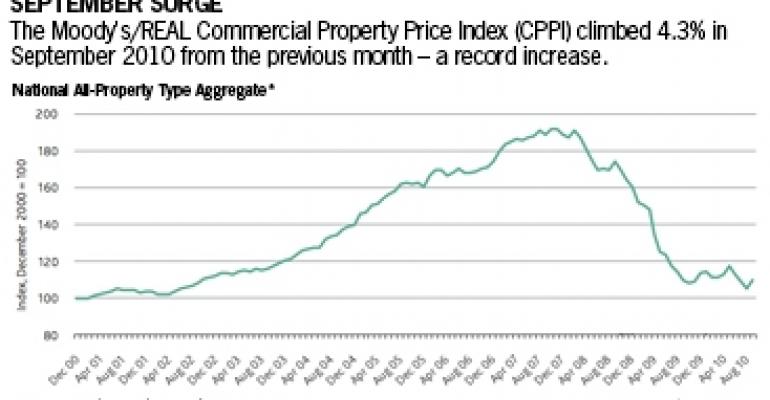
U.S. commercial real estate prices climbed 4.3% in September from the previous month, according to the Moody’s/REAL Commercial Property Price Indices (CPPI). That’s the largest one-month gain in the index’s nine-year history, and is encouraging for a market that has wrestled with deflated property values for nearly three years now.
Yet experts debate whether the gains will last, or will instead prove to be one in a series of severe fluctuations. The spike is small in relation to the overall, 42.7% value decline the index has tracked since the market peaked in October 2007. The CPPI measures transaction price changes for commercial real estate assets based on repeat sales valued at $2.5 million or more.

And there is no guarantee that September’s positive performance will be repeated in a year marked by index volatility. In the first nine months of 2010, the All Property Type Aggregate Index has logged five monthly gains and four monthly declines. In fact, the past year’s ups and downs have nearly balanced out: The All Property Type Aggregate Index was up just 0.3% in September from a year ago.
Moody’s analysts chalk up the recent volatility to economic uncertainty and low sales volume. But the changing mix of trading properties is also having an effect on index values, according to Dan Fasulo, managing director at New York-based Real Capital Analytics, which provides the sales data reflected in the Moody’s/REAL Indices.
Many of the assets selling today involve some form of distress, which can result in lower prices than willing sellers would accept, explains Fasulo. Investors, too, are branching away from an exclusive focus on core assets in primary markets to acquire real estate with greater risk profiles and lower prices. “There are lower-quality assets now in the data set and it is causing these pretty violent changes month to month,” says Fasulo.
Results were mixed among property types, with apartments and retail showing price gains while industrial and office assets continued to lose value nationwide.
In the largest metro areas, retail and office properties showed positive returns exceeding 9% in the third quarter from the second quarter. Industrial properties logged losses of nearly 10% during the same period, according to Moody’s.
Think big picture
Commercial real estate price indexes have been good, general indicators of pricing trends, according to Jamie Woodwell, vice president of commercial real estate research at the Mortgage Bankers Association.
“The (upward) trajectory was pretty clear during the 2005-2007 period, and you had pretty clear (downward) direction in the 2007 through early 2009 period,” observes Woodwell. “Since then we have seen those fluctuations, and it’s hard to pin down exactly what those mean.”
Fluctuations may obscure subtle trends, as Woodwell points out. On the other hand, the volatility that seems to be clouding index returns may in fact be a close indicator of pricing trends, according to David Geltner, director of research for the MIT Center for Real Estate and one of the engineering forces behind the CPPI’s methodology.
“This type of extreme volatility probably largely reflects what is actually going on in the U.S. commercial property market, as asset markets typically display greater volatility during periods of fundamental uncertainty, rapid economic and institutional or political change, and transition in the markets,” Geltner writes. The MIT researcher’s observations on the September index results are posted in a column titled The Professor’s Corner on the Real Estate Analytics LLC website at http://www.realindices.com/. Real Estate Analytics developed the Moody’s/REAL Indices.
Plenty of data
Insufficient data, at least, is no longer a hindrance to price index calculations, according to Fasulo. Low sales volume in 2009 has given way to a more robust market this year, with 153 repeat-sale transactions in September alone, Moody’s reported. Sales volume by dollar amount jumped to $3.7 billion from $1.85 billion in August. That gave September the largest dollar amount of repeat-sale transactions since January 2008.
“There are certainly enough data points to calculate the index at this point and we are way past the low point of the transaction cycle by now, so I don’t see that as being a problem going forward,” says Fasulo.
Geltner suggests that mushrooming sales volume is perhaps the best corroborating evidence that September’s pricing gain is the beginning of an upward trend. Looking beyond repeat sales to include all commercial real estate sales, September trading volume was $10.4 billion, a two-year high. “Indeed, volume has been trending gradually upward every quarter this year,” he writes, “with energetic activity in both the upper/trophy and bottom/distressed segments of the market.”
Taking a long-term look at the indexes, Fasulo notes that the severe decline in asset values that began in late 2007 had run its course by the third quarter of 2009. He reads the results from the 12 months since then as indicating a market at the bottom of the transaction cycle.
Further, he believes that’s where the market will stay until returning job growth and economic expansion can boost demand for commercial real estate. “Until underlying fundamentals recover in a really strong way, with rents and occupancy levels showing a clear upward trend nationwide, you’ll continue to see the index bounce along the bottom.”