

 Despite a painfully sluggish recovery up to this point, office market fundamentals continue to improve, with fourth quarter 2014 results being among the best seen since the recession. Occupied stock rose by 11.2 million sq. ft. in the fourth quarter, the strongest figure for net absorption since 2007. Moreover, asking and effective rents rose by 1.1 percent and 1.0 percent, respectively, which represents the fastest rate of growth in both categories since the recession began in early 2008.
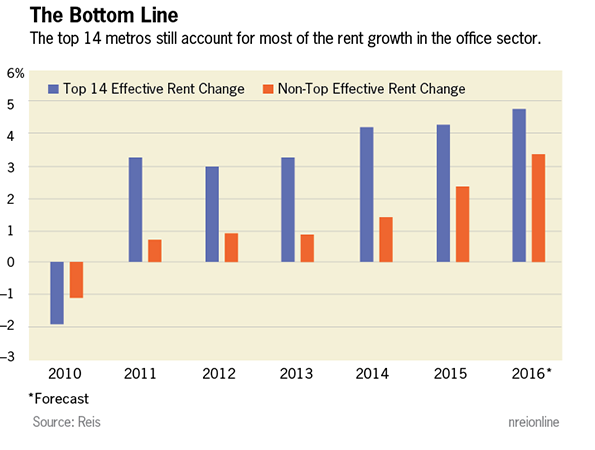
However, one major caveat remains. While the headline figures appear promising, a small number of markets are driving performance, while many others struggle to generate any meaningful rent growth. To get a better picture of the extent of rent growth concentration amongst the top office metros, consider that average effective rents increased 3.0 percent in 2014. Out of the 82 primary metros that Reis covers, just 14 had annual rent growth greater than 3.0 percent. Rent growth was so strong in those 14 markets that it pushed the national growth rate far above what most metros have experienced over the past year. We will focus on these 14 metros as one group for the purposes of this analysis.
Over 62 percent of the increase in occupied stock during the fourth quarter can be accounted for by the top 14 performers. Over the full year 2014, the top markets accounted for just under 73 percent of all absorption. Admittedly, there is somewhat of a size-bias here. Many of these outperformers are also among the larger office markets in the country: New York, Houston, Dallas and Boston all rank among the 10 largest, while San Francisco, Denver, Orange County, Calif. and Seattle are close behind. Yet the figures still support the heavy concentration of outperformance; the 14 markets referenced above account for 40 percent of total inventory, well below the nearly 73 percent share of overall absorption attributed to them.
Occupancy trends among these top markets have also outpaced the rest of the nation. Vacancy among the outperformers hit a cyclical high of 16.1 percent in the third quarter of 2010 and has fallen to 14.1 percent as of the end of 2014. The decline in vacancy has been much slower among the rest of the nation—vacancy in those metros hit a cyclical high of 18.7 percent in the second quarter of 2011 and has fallen only to 18.4 percent as of year-end 2014. The discrepancy in vacancy trends will shrink slightly in the coming years as construction in top markets outpaces activity elsewhere. Inventory in the top-performing metros grew by 1.2 percent in 2014 and is forecasted to grow almost 3.0 percent over the next two years. In contrast, the underperformers saw inventory grow of just 0.4 percent in 2014 and will only see growth of 1.2 percent over the next couple of years. Yet a faster pace of occupancy gains for underperforming markets is also a function of having significantly higher levels of vacancy and thus, much more room for compression.
Outsized rent gains among the recent outperformers are expected to persist for several years to come. Reis projects rent growth in the top 14 markets to outpace all other metros by nearly 200 basis points in 2015 and more than 100 basis points for several years thereafter. This shouldn’t be a surprise when you consider how concentrated office-using job growth is across the country. Office employment among the top-performing markets grew 11.3 percent over the last five years, compared with 7.3 percent in the rest of the country. Employment growth rates will likely converge over the next few years, but the top end of the market will already be well ahead of the rest of the country by that point.
The common thread between most of the top performers is the prevalence of the tech and energy industries. In fact, the top four on the list, San Jose (+7.2 percent effective rent growth in 2014), San Francisco (+6.8 percent), Dallas (+5.2 percent) and Houston (+5.1 percent), hail from California and Texas, typically considered the bellwether states for their respective sectors. There are a couple of outliers, such as Washington, D.C. and Miami, but for the most part, the concentration of rent growth is due to the existence of vibrant local energy and tech hubs within these metros.
The benefits of these hubs extend beyond just tech and energy firms themselves leasing space. For example, firms in the automotive and aerospace industries are seeking a presence in tech hubs as technology becomes ever more integrated into their products. This is further boosting demand in the top-performing markets, in some cases at the expense of underperformers.
We should note that the decline in the price of oil has the potential to dent gains in office markets with substantial exposure to the energy industry, especially Houston. Given that several of the outperforming office metros are heavily reliant on energy firms, this could impact the discrepancy between outperformers and underperformers on the margin. However, note that Reis has already revised our forecast downward for the office market in Houston, as we detailed in our column last month (http://nreionline.com/industrial/low-energy-prices-impact-cre-may-be-negligible). The forecasts referenced above already incorporate those revised figures.
While the headline figures for the fourth quarter were promising, the breadth of the recovery in the office sector should not be overstated. Some metros are performing quite well, but many continue to languish. The office sector is still far from being considered “healthy,” as evidenced by the lack of development activity. Currently, there are few office buildings being developed without significant pre-leasing requirements that are not built-to-suit properties. On the bright side, relatively strong job growth bodes well for the property type; as new hires soak up excess space currently under lease, firms will begin to expand their footprints at a faster rate.