
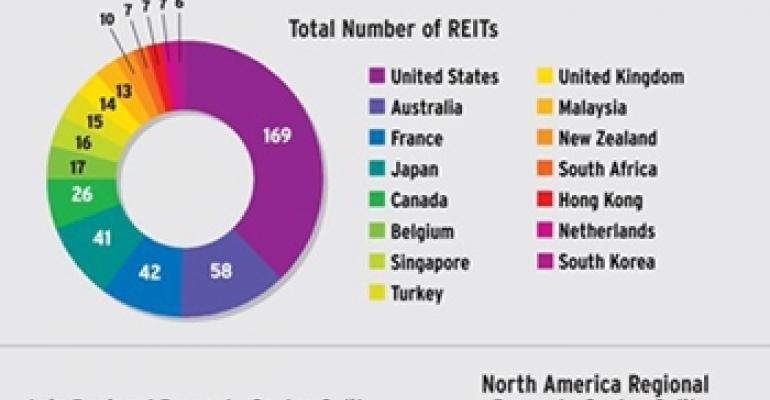
Across the REIT Universe
The United States boasts the greatest number of REIT's. The breakdown of property types in North America is also the most balanced of any region.

Up and Down
The markets that had the five lowest and five highest rates of growth.

A Look Through Stock Prices
A rough month in the stock market sent most retail REITs into negative territory for the year.

| Symbol | Price* | 52-week High | Chg | 52-week Low | Chg | 31-Dec-06YTD | Chg | |
|---|---|---|---|---|---|---|---|---|
| Tanger Factory Outlet Centers | SKT | $42.94 | $44.43 | -3.35% | $32.32 | 32.86% | $39.08 | 9.88% |
| Acadia Realty Trust | AKR | $26.87 | $29.00 | -7.34% | $21.71 | 23.77% | $25.02 | 7.39% |
| Saul Centers | BFS | $57.85 | $61.70 | -6.24% | $41.86 | 38.20% | $55.19 | 4.82% |
| Taubman Centers | TCO | $53.24 | $63.87 | -16.64% | $44.49 | 19.67% | $50.86 | 4.68% |
| Realty Income Corp. | O | $28.72 | $30.36 | -5.40% | $22.87 | 25.58% | $27.70 | 3.68% |
| National Retail Properties | NNN | $23.60 | $26.15 | -9.75% | $20.65 | 14.29% | $22.95 | 2.83% |
| Federal Realty Investment Trust | FRT | $80.94 | $98.92 | -18.18% | $70.13 | 15.41% | $85.00 | -4.78% |
| Agree Realty Corp. | ADC | $32.00 | $36.46 | -12.23% | $27.29 | 17.26% | $34.37 | -6.90% |
| Simon Property Group | SPG | $91.23 | $123.96 | -26.40% | $82.60 | 10.45% | $101.29 | -9.93% |
| General Growth Properties | GGP | $46.99 | $67.43 | -30.31% | $42.40 | 10.83% | $52.23 | -10.03% |
| The Macerich Co. | MAC | $77.49 | $103.59 | -25.20% | $71.22 | 8.80% | $86.57 | -10.49% |
| PREIT | PEI | $34.84 | $50.39 | -30.86% | $34.37 | 1.37% | $39.38 | -11.53% |
| Equity One Inc. | EQY | $23.57 | $30.88 | -23.67% | $22.19 | 6.22% | $26.66 | -11.59% |
| Kite Realty Group | KRG | $15.96 | $21.80 | -26.79% | $15.02 | 6.26% | $18.62 | -14.29% |
| Regency Centers Corp. | REG | $66.73 | $93.49 | -28.62% | $61.99 | 7.65% | $78.17 | -14.63% |
| Urstadt Biddle Properties Inc. | UBA | $15.86 | $19.73 | -19.61% | $14.48 | 9.53% | $19.09 | -16.92% |
| Kimco Realty Corp. | KIM | $37.27 | $53.60 | -30.47% | $33.74 | 10.46% | $44.95 | -17.09% |
| Inland Real Estate Corp. | IRC | $14.64 | $21.14 | -30.75% | $13.50 | 8.44% | $18.72 | -21.79% |
| Weingarten Realty Investors | WRI | $36.04 | $52.30 | -31.09% | $35.23 | 2.30% | $46.11 | -21.84% |
| Vornado Realty Trust | VNO | $92.60 | $136.55 | -32.19% | $83.59 | 10.78% | $122.35 | -24.32% |
| Cedar Shopping Centers Inc. | CDR | $11.84 | $18.42 | -35.72% | $11.42 | 3.68% | $15.91 | -25.58% |
| Glimcher Realty Trust | GRT | $19.67 | $29.69 | -33.75% | $19.39 | 1.44% | $26.71 | -26.36% |
| Developers Diversified Realty Corp. | DDR | $44.40 | $72.33 | -38.61% | $44.23 | 0.38% | $62.95 | -29.47% |
| Capital Lease Funding | LSE | $8.14 | $12.21 | -33.33% | $7.96 | 2.26% | $11.60 | -29.83% |
| Cousins Properties Inc. | CUZ | $23.67 | $40.75 | -41.91% | $23.54 | 0.55% | $35.27 | -32.89% |
| Ramco-Gershenson Properties Trust | RPT | $25.19 | $39.55 | -36.31% | $24.50 | 2.82% | $38.14 | -33.95% |
| CBL & Associates Properties | CBL | $27.94 | $50.36 | -44.52% | $27.20 | 2.72% | $43.35 | -35.55% |
| Colonial Properties Trust | CLP | $24.31 | $51.69 | -52.97% | $24.31 | 0.00% | $46.88 | -48.14% |
| Feldman Mall Properties | FMP | $2.99 | $13.00 | -77.00% | $2.70 | 10.74% | $12.45 | -75.98% |
| * As of 11/19/2007 Source: Retail Traffic | ||||||||
0 comments
Hide comments