Rollover risk is particularly important for office properties because of the large share of space occupied by specific tenants. The largest tenants in typical office buildings may occupy anywhere from one-third to three-fourths of the total space.
A single-tenant office building therefore has no diversification when it comes to income sources. If the sole tenant does not renew its lease, the building’s entire income stream is lost until a replacement can be found.
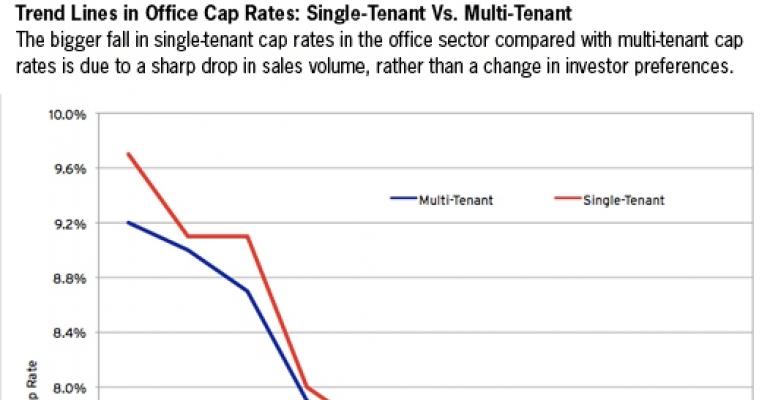
Because of the risk associated with an undiversified income stream, multi-tenant properties typically trade at lower cap rates versus single- tenant properties. Cap rates trended wildly from 2001 to 2008, but on average multi-tenant properties transacted at a 7.85% cap rate, versus an 8.01% cap rate for single-tenant properties.
However, this trend was reversed when the last recession took hold. Over the last couple of years, single-tenant properties have been trading at lower cap rates than multi-tenant buildings. Specifically, single-tenant cap rates have been hovering at around 7%, while multi-tenant cap rates are around 7.5%.

Year-to-date figures for 2011 are even more pronounced, with a spread of 70 basis points between single-tenant cap rates at 6.5% and multi-tenant cap rates at 7.2%. This is the largest spread between single-tenant and multi-tenant cap rates in the last 10 years. Ironically, the lower cap rates were for single-tenant buildings — the asset class with the riskier income stream.
The puzzle resolved
It is not that the market has undergone a sea change in how it values risk for these two different office property subtypes. The reason single-tenant cap rates have fallen so much relative to multi-tenant cap rates is the severity of the pullback in transaction volume stemming from the last recession.
The combined transaction volume for multi-tenant and single-tenant office properties fell from $100.7 billion in 2007 to $12 billion in 2009, a drop of 88%. Transaction volume picked up in 2010 to $27.2 billion, but has yet to truly recover given that credit remains tight.
As of 2011, only about $2 billion worth of single-tenant properties have traded hands compared with $7.4 billion for multi-tenant properties. Single-tenant properties fetch a higher average price as well, at $76 million per transaction versus $32 million for the average multi-tenant building that sold.
The deal volume implies that there is more selectivity by investors when it comes to single-tenant property transactions. Investors are still nervous about tepid U.S. economic growth and many other problems in the global economy.
Given the higher rollover risk associated with single-tenant properties, only those buildings with reliable tenants locked into long-term leases will tend to find a buyer. And that buyer will usually pay a premium.
For example, consider the sale of the Overlake Office Center in Seattle, a 122,000 sq. ft. property that sold for $46 million in late 2010. It boasts a reliable single tenant, Microsoft, that occupies the entire space in a long-term lease that doesn’t expire until 2015.
The building also is located across from Microsoft’s corporate headquarters, indicating that unless the company plans a severe cutback in leased space, the property can probably count on a stable income stream for the foreseeable future. It sold at a reported cap rate of 6.4%, dragging down the overall average.
Multi-tenant properties also are selling at relatively low cap rates, with some properties trading under 5%. But because there are also more transactions occurring in this particular subtype, the low cap rates on property sales aren’t dragging down the overall figure as much.
In other words, as transaction volume for both property subtypes increases over the next year or two, expect cap rates for single-tenant buildings to drift upward relative to multi-tenant properties.
Victor Calanog is head of research and economics for New York-based research firm Reis.

