1 9
1 9
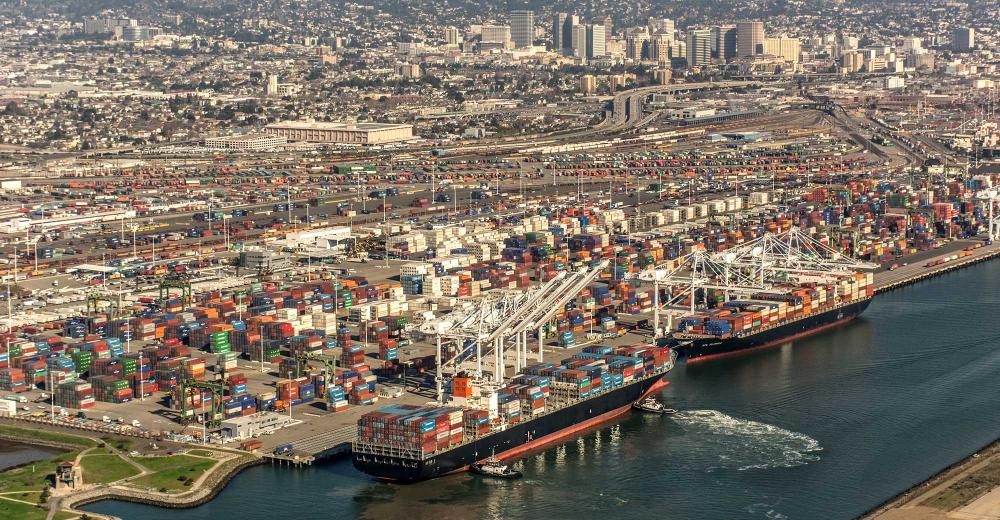
The Port of Oakland, normally one of the busiest ports in the country, has experienced moderate impact from the COVID-19 pandemic and the related disruptions to maritime trade. Year-to-date, overall container volume was down by about 5 percent compared to the same period in 2019. The port handled approximately 298,475 TEUs loaded inbound through the first quarter, a 2.9 percent drop year-over-year, and 322,158 TEUs loaded outbound, a 3.7 percent year-over-year increase.
The Port of Charleston handled around 337,761 TEUs loaded inbound year-to-date, a 2.5 percent drop compared to the same period in 2019, and 272,428 TEUs loaded outbound, a 1.6 percent drop year-over-year. However, the port and the surrounding industrial markets are expected to make a quick recovery in 2021, according to Colliers researchers, in part due to demand from cold storage 3PLS.
The Northwest Seaport Alliance, which combines the ports of Seattle and Tacoma, handled around 375,565 TEUs loaded inbound year-to-date, an 18 percent decline compared to the same period last year, and 281,313 TEUs loaded outbound, an 8.3 percent decline from 2019. While the industrial markets surrounding the ports, including Puget Sound, will likely experience some softening as a result of the pandemic, according to Colliers researchers, the fact that the area relies primarily on high-tech industries to drive its growth should allow demand for space to rebound relatively quickly.
The Port of Virginia handled its highest loaded container volume in a decade in 2019, at almost 2.3 million containers. In 2020, however, it experienced a steep decline in overall TEU volume at 10 percent. The port handled around 405,882 TEUs loaded inbound year-to-date, a 8.1 percent decline compared to last year, and 322,081 TEUs loaded outbound, representing a 2.2 percent decline. However, the industrial markets served by the Port of Virginia have continued to attract large port-related tenants like Amazon, which has announced plans to occupy 5.5 million sq. ft. of industrial space in Richmond and Norfolk, Va., for example.
At the start of 2020, the Houston market experienced two simultaneous crises: the collapse in oil prices and the COVID-19 pandemic and related shutdowns. The Port of Houston handled 383,306 TEUs loaded inbound year- to-date, a 2.3 percent decline compared to the same period last year, and 436,416 TEUs loaded outbound, a 9.3 percent increase year-over-year. However, the Port of Houston drives industrial demand not only for its immediate surroundings, but for many regional markets as well, chief among them the Dallas-Forth Worth area, and those markets have seen major retail operators, ranging from Amazon and Costco to Home Depot, expand into big-box industrial facilities. In addition, U.S. Army Corps of Engineers recently approved a $1 billion project to widen the Houston port channel, which will expand the port’s capacity and allow its marine terminals to handle two 14,000 TEU vessels at once. The project is scheduled to start construction in 2021.
At the end of 2019, the Port of Savannah set a record, handling nearly 3.7 million loaded TEUs. But year-to-date, the port handled just 672,482 inbound TEUs, representing a 6.8 percent decline year-over-year, and 505,539 TEUs loaded outbound, a 1.7 percent decline. Despite the challenges created by the COVID-19 pandemic, the Savannah industrial market began 2020 on a strong footing, with more than 1.6 million sq. ft. of positive absorption. Many imports from the Port of Savannah flow into other industrial markets, including Atlanta. Atlanta remains one of the most in-demand markets for big-box industrial space, according to Colliers. As U.S. supply chains begin to reconfigure their current structures as a result of issues highlighted by COVID-19, the Atlanta and Savannah industrial markets stand to benefit, the firm’s researchers predict. About 23.4 million sq. ft. of industrial space was under development in the two markets at the end of the first quarter of 2020, which means there should be plenty of available space for users to expand as they adjust their inventory levels.
The Port of Long Beach, which supports many of the same industrial markets as the Port of Los Angeles, handled about 1 million TEUs loaded inbound year-to-date, a 12.2 percent drop year-over-year, and 482,127 TEUs loaded outbound, a 0.9 percent decrease. Inbound TEUs at the port were already trending down in 2019, but the pandemic further lowered both its inbound and outbound TEU totals. However, in May, the port did experience its first cargo volume uptick of the year, when volume went up by 9.5 percent compared to the same period in 2019.
The Port of New York and New Jersey’s cargo volume year-to-date through April remained relatively steady, with a total of 2.3 million TEUs for the first four months of 2020, representing a 3.4 percent decline from the same period last year. The port handled approximately 1.2 million TEUs loaded inbound so far this year, a 2.1 percent drop year-over-year, and 466,381 TEUs loaded outbound, a 4.1 percent decrease year-over-year. Cargo from the port helps create demand for more than one billion sq. ft. of warehouse and distribution space within a 50-mile radius of its terminals.
The Port of Los Angles, the country’s largest gateway for international cargo, handled roughly 1.3 million TEUs loaded inbound year-to-date, representing an 11.2 percent decrease compared to the same period in 2019, and 534,142 TEUs loaded outbound, an 11.3 percent decrease in year-over-year. Despite the pandemic, demand for industrial space in the greater Los Angeles region, including the demand stemming from the ports, has remained stable. In fact, the Inland Empire, 50 miles east of the Port of Los Angeles, has become the most in-demand industrial market in the country.

