1 13
1 13
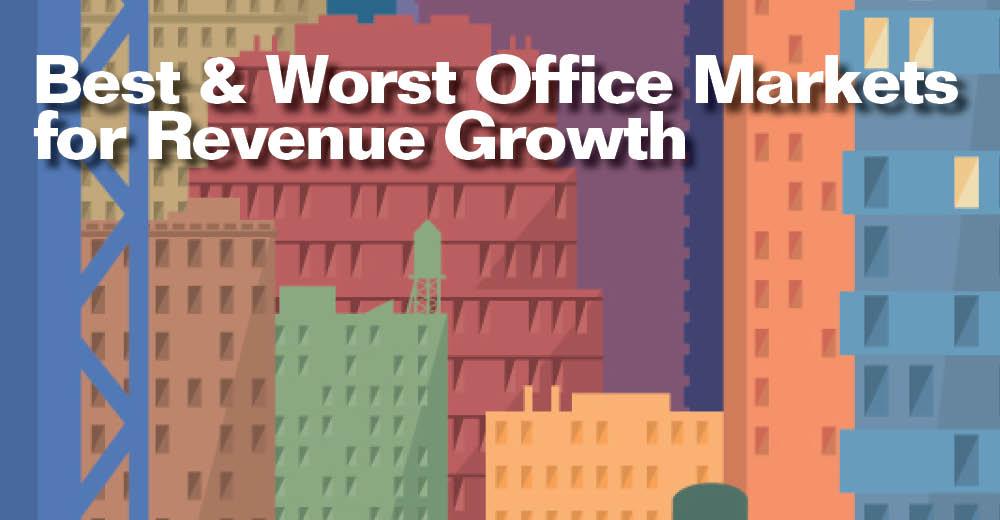
For investors looking for the inside track on real estate investment hot spots, the results are in on some of the best—and worst—office market performers in the second quarter of 2016. Research firm Reis Inc. recently released data that shows markets with the biggest year-over-year changes in effective revenue per sq. ft. during the period.
This market snap shot also offers insight into some clear market trends. The tech sector continues to have a big influence on boosting performance in many office markets. And while it may not be entirely fair to single out some of the laggards on the list, there are some clear trends there as well. According to Reis, smaller tertiary markets continue to struggle to rekindle economic and job growth that will fuel demand for more office space.
With the average cost per workstation of $16,205, San Francisco took the second spot nationally and fifth globally.
The Seattle market reported an annual 6.5 percent increase in its effective revenues in the second quarter, to average $25.08 per sq. ft., according to Reis. Home to major employers such as Boeing, Microsoft and Amazon, Seattle has seen some of the strongest office employment growth in in the U.S. this year. Real estate services firm JLL recently named Seattle-Bellevue as #4 on its list of most resilient tech markets, with a market score of 82.3 due in part to a high volume of STEM grads and success in attracting Millennials. The average price per sq. ft. that investors paid in Seattle over the 12 months ending in June was $359.83, according to RCA.
Just across the Bay from San Francisco, developers are busy in towns like Oakland and Berkeley, Calif. The area is number eight on CoStar’s list of top markets for new development.
Developers had 11,632 new units of multifamily housing in some phase of the development process in the East Bay in the third quarter of 2018, according to CoStar. That works out to 7.0 percent of the current inventory.
MPF counts 6,936 new rental apartments under construction in the Oakland-Hayward-Berkeley metro area. That’s equal to 3.4 percent of the inventory across the metro area.
Milwaukee is reporting positive effective rent growth at 0.2 percent and the market is performing better than the numbers suggest. Concessions are offsetting otherwise modest increase in rent growth. Tertiary markets have been struggling to regain momentum, and Midwest cities in particular have been lagging behind in the recovery. “If you look at all of the metros, most of those in the bottom one third are generally Midwestern,” says Denham. The average price per sq. ft. that investors paid in Milwaukee over the 12 months ending in June was $116.76, according to RCA.
Effective rents remained relatively flat in Dayton at -0.1 percent. However, the city is also reporting one of the lowest effective revenues per sq. ft. at $8.36, according to Reis. Dayton has been at the bottom fairly consistently over the past few years. It is a very small market, and does not perform as well as its bigger neighbors such as Columbia, Cleveland and Cincinnati. Its office vacancy rate is one of the highest in the country. The average price per sq. ft. that investors paid in Dayton over the 12 months ending in June was $196.25, according to RCA.
Richmond reported a slight decline in effective rents in the second quarter at -0.3 percent to $13.48 per sq. ft., according to Reis. Richmond’s economy is faring better than the numbers suggest, however. Job growth in Richmond has been healthy, but concessions have cut into rent growth. The average price per sq. ft. that investors paid in Richmond over the 12 months ending in June was $139.49, according to RCA.
In Lexington, annual effective revenues declined 1.0 percent in the second quarter to average $11.02 per sq. ft., according to Reis. Many smaller markets are having a tougher time restarting their economic engines in the wake of the recovery and that is the case in Lexington. Its office employment growth has been negative in 2016. Lexington may also be struggling to come out from the shadow cast by stronger peers in the region, such as Louisville and nearby Nashville, according to Denham. The average price per sq. ft. that investors paid in Lexington over the 12 months ending in June was $181.86, according to RCA.
During the second quarter, effective revenues in Tacoma fell 1.1 percent to average $14.06 per sq. ft., according to Reis. Although the Tacoma apartment market has seen positive spillover demand from Seattle, its office market has not, says Denham. That is likely due to the fact that office rents in nearby Seattle have not surged high enough to push tenants to look for lower cost market alternatives. Tacoma also reported negative net absorption in the second quarter. Investors who bought property in Tacoma in the past year paid an average of $225.33 per sq. ft., according to RCA.