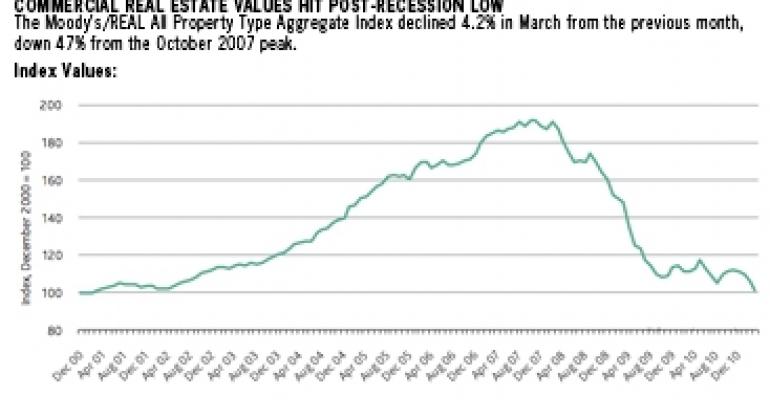
An index of U.S. commercial real estate prices fell to a cyclical low in March that was down 47% from the peak in October 2007. So why should investors be happy?
The Moody’s/REAL National All Property Price Index measures price changes on completed sales of apartment, office, industrial and retail properties. A 4.2% decline in the index since February stems in part from a surge in transaction volume among distressed properties, which accounted for more than 30% of March sales.

Mushrooming trading of distressed assets means that investors and lenders are realizing losses on their distressed assets on a massive scale. Experts say that process is painful, but those price corrections must occur in order for the nation’s commercial real estate market to regain its footing and for overstretched property owners to de-lever and bring cash flows into positive territory.
“Importantly, we’ve now set a post-peak low in the all-property index simultaneously with a post-peak high in distress transactions,” observes Tad Philipp, director of commercial real estate research at Moody’s Investors Service, which publishes the index.
In other words, the decline in the all-property index doesn’t necessarily mean commercial real estate values are dropping. The recent dip is more a reflection of the larger proportion of transactions involving distressed assets, which bring down the average. Indeed, in primary markets where distress represents only a small fraction of transaction volume, asset values are well into a recovery cycle.
Primary price leaders
“The commercial real estate world in the five or six primary markets is as active as it has ever been in terms of desire for the properties and pricing, the backdrop being that interest rates are low,” says Bill Collins, an executive managing director who oversees the capital markets group at Cassidy Turley in Washington, D.C.
With risk-averse investors focused on a handful of gateway markets that include places like New York City, San Francisco and the nation’s capital, competitive bidding has been pushing up transaction prices in those metros for some time, Collins says.
“You’ve got a lot of capital looking to be placed,” says Collins. “The fact that there’s only 60% leverage available and 40% equity required to close a deal really doesn’t matter; people don’t need to stretch their dollars because they have this accruing pool of dollars they need to place.”
Indeed, Moody’s researchers found that average prices in the primary markets already show marked improvement. An index of non-distressed, trophy properties — those valued at $10 million or more and located in one of six major U.S. markets — in March showed property prices have risen 26.7% from a trough in December 2009.
(The six cities covered in the index are Boston, Chicago, Los Angeles, New York, San Francisco and Washington.)
In fact, pricing gains are evident among trophy assets even when distressed transactions are included in the calculation. A separate Moody’s index measuring trophy property sales including distressed deals indicates that prices have risen 22.9% since that index bottomed in July 2009. “This is consistent with liquidity in the commercial real estate sector first returning to prime assets in capital-attracting cities,” says Philipp.
Crank up the volume
A recent pick-up in transaction volume is a sign that the U.S. commercial real estate market is on the mend, because moving distressed properties through the system sets the stage for recovery, according to Moody’s.
In March, there were 182 repeat-sales transactions totaling nearly $2.5 billion, a significant increase over February’s $1.26 billion volume and 115 repeat sales. March had the second-highest number of repeat-sale transactions since 2008, the total only exceeded by that of December 2010, which benefitted from being the end of the year.
Moody’s uses repeat sales, or multiple sales of the same property over time, to calculate price changes in its indices. Looking at the larger transaction spectrum, sales of U.S. commercial real estate valued at $5 million or more totaled more than $28 billion in the first quarter of 2011, up 77% from $15.9 billion one year earlier, according to Real Capital Analytics.
Moody’s national indices showed declining prices across property types in the first quarter. Industrial recorded the largest decline, falling 7.7% from the previous quarter to a post-peak low. Office was down 7.1% from the previous quarter but was up 1.9% from its low in the third quarter of 2009.
Apartments were down 4.7% from the fourth quarter of 2010, but were up 14.1% from that sector’s low in the third quarter of 2009. Retail was down 4.5% from the previous quarter but up 9.4% from a bottom in the second quarter of 2010.
Investors can expect the all-property price index to “bounce along the bottom” until more distressed assets move through the market, Philipp predicts.
On a positive note, the special servicers that handle distressed conduit loans in commercial mortgage-backed securities (CMBS) are resolving those debts at a rate about equal to the pace of CMBS debts falling into delinquency. That is resulting in a fairly stable delinquency rate, which stands at 9.22%.
Taken together with swelling transaction volume, the commercial real estate industry appears to be making progress in dealing with distress, says Philipp. “The resolution process for this transaction cycle appears to be well under way.”

