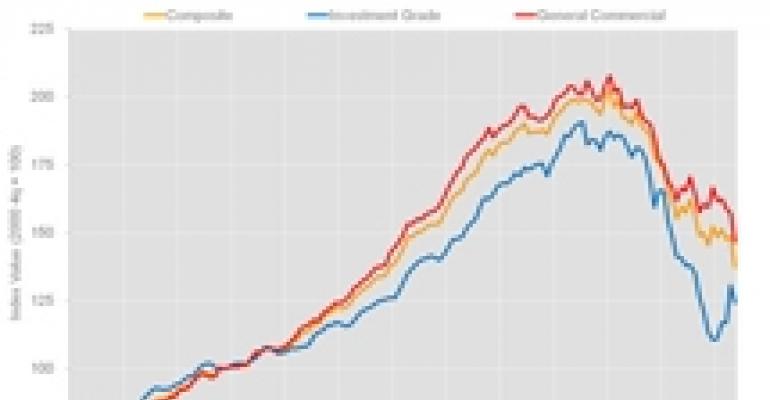
There’s a new entrant in the field of commercial real estate price indices.
Bethesda, Md.-based CoStar Group Inc. launched what it’s calling the CoStar Commercial Repeat-Sale Indices (CCRSI), which it will update monthly. It will be the second active index joining the Moodys/REAL Commercial Property Index that is produced jointly by the MIT Center for Real Estate and Moody’s Investors Service using data from Real Capital Analytics. (You can download the indices’ methodology here.)

In its initial report, CoStar found that there are two worlds in commercial real estate pricing, with large markets drawing institutional capital that’s pushing prices up while deal volume everywhere else continues to soften. The index, however, does indicate that even on the best properties in the strongest markets values are now showing signs of softening.
Over the past 10 months CoStar has seen the overall CCRSI oscillate from positive to negative and back again, with preliminary July figures very likely to be down for the investment grade property markets. From May to June, the overall CCRSI was down 7.78 percent with the investment grade property declining by 4.83 percent, reversing previous positive movement.
According to CoStar, “The pause in some of the positive price trends we are now observing corresponds to renewed uncertainty in the U.S. economy, persistent weakness in the housing market, as well as concerns surrounding the European economy. In addition, financial reform has slowed commercial mortgage markets as lenders are now in the process of interpreting capital requirements and ‘skin-in-the-game’ provisions.”

One unique piece of the index is that it attempts to analyze distressed deals as a percent of overall market activity. According to CoStar, since 2007, the ratio of distressed sales to overall sales has gone from around 1 percent to above 23 percent currently. Distressed sales as a percent of transaction volume are highest for hospitality at 35 percent followed by multifamily at 28 percent, office at 22 percent, retail at just under 20 percent and industrial at about 17 percent. These volumes appear to be stabilizing.
In addition to the national monthly index, CoStar will compile quarterly indices by submarket and property type.

By property type, the national retail index suffered the most in the second quarter of 2010 with a drop of 12.2 percent, in part because the top ten retail markets had 17.7 percent drop in prices. The retail index in the top 10 MSAs is also down 17.6 percent year-over-year and 29.2 percent compared with 2008. The national retail index, meanwhile, is down 16.0 percent year over year and 27.2 percent compared with 2008.
By region, the Northeast and Midwest retail indices suffered the largest declines during the quarter. Conversely, the indices in those regions are down less compared to 2008 than either the West or the South.


