If consumer demand holds the key to a rebound in seniors housing, then owners and operators will be encouraged by the latest quarterly findings on the overall health of the industry. The annual pace of absorption registered 1.4% in the fourth quarter, consistent with the prior quarter and up from 0.8% in the fourth quarter of 2009.
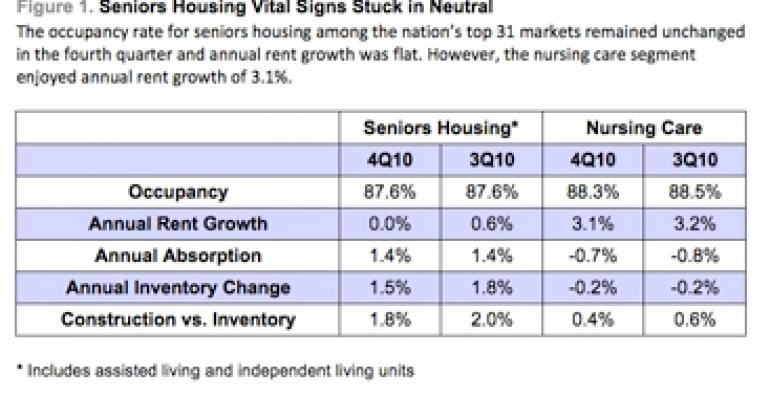
But the uptick in absorption was offset by a 1.5% rise in the annual inventory of seniors housing [Figure 1]. Consequently, the overall occupancy rate was unchanged at 87.6% in the fourth quarter and annual rent growth was flat, according to the National Investment Center for the Seniors Housing & Care Industry based in Annapolis, Md.

“It’s clear that occupancy rates have established a pattern of trending sideways over this past year, while the pace of year-over-year rent growth continues to slow,” says Michael Hargrave, vice president of NIC MAP, which tracks properties in the nation’s top 31 metropolitan statistical areas (MSAs) to compile the results. One year ago, annual rent growth was 1.8%, two years ago it was 2.9%, and three years ago it was 3.8%.
About one in five properties (20.4%) in the latest survey reported to NIC MAP that they had negative year-over-year rent growth, up from 17.9% the previous quarter. “If you are a proponent of the sector, you want to see that trend in rents reverse itself in the next few quarters,” says Hargrave.
The latest occupancy figure can be interpreted as a glass half full rather than a glass half empty, says Hargrave. Beginning in early 2007, occupancy had been in a steady state of decline through the second quarter of 2009. Since then occupancy has ranged from 87.3% to 87.9%, a clear sign of stabilization. At its peak in early 2007, the occupancy rate was 91.9%.
Construction activity dwindles
The pace of annual inventory growth for seniors housing during the fourth quarter slowed to 1.5%, representing the lowest level of annual inventory growth on record since NIC MAP began tracking inventory. Annual inventory growth slowed from 1.8% the previous quarter. A year ago the pace of annual inventory growth was 2.3%. The seniors housing inventory over the past five years had been growing at an average annual rate of 2.1%.
Construction activity for seniors housing slowed slightly in the fourth quarter to 1.8% of existing inventory, down from 2% the previous quarter and 2.3% one year ago. In the previous three quarters, the construction inventory pipeline ranged from 2% to 2.2%. “The one really strong thing you can take away from the data is we are seeing further signs of the construction pipeline shrinking. That’s a very good sign,” says Hargrave.
Meanwhile, in the nursing home segment annual rent growth was 3.1% in the fourth quarter. Inventory growth showed a slight negative decline on an annual basis of 0.2% in the fourth quarter of 2010, and annual absorption declined 0.7%. For the past five years, the inventory of nursing homes has been shrinking at an annual rate of 0.3%, according to NIC.
Mixed bag for Phoenix
Some markets are experiencing a very uneven recovery, underscoring the challenges ahead. While the health of the assisted living sector in Phoenix is clearly improving, the independent living segment is still searching for a bottom. The occupancy rate for independent living units declined from 91.5% in the third quarter of 2007 to 84.3% in the third quarter of 2010, a drop of 720 basis points. The occupancy rate for independent living did recover 30 basis points in the fourth quarter of 2010 to 84.6%, but that’s still well below 2007 levels [Figure 2].

New supply is the culprit. Some 1,600 independent living units have been delivered to the Phoenix market since the first quarter of 2008, says Hargrave. That has proven to be a drag on the independent living market. Among 58 stabilized assisted living properties in Phoenix, 16 are reporting occupancy at or below 80%. That’s more than one in four properties (27%).
On the surface, Phoenix appears to be a highly attractive market for seniors housing developers, explains Hargrave. It’s a major metro market in a Sunbelt state with favorable demographics and a potentially high concentration of prospective customers. “But when you look at the underlying dynamics of what’s happened over the last few years in the local market, you can see that there has been some challenges on the independent living side.”
The news is much better for assisted living in Phoenix. After hitting a cyclical low of 85.4% in the second quarter of 2009, the occupancy rate for assisted living has risen 400 basis points to 89.4%. Here again, supply is a factor. The assisted living inventory in Phoenix has only grown by 186 units since the first quarter of 2008.
Which markets are among the stellar performers when it comes to occupancy? The big cities in the Northeast and Mid-Atlantic, including Boston, New York and Baltimore, have outperformed most other markets in part because of their high barriers to entry.
During the recession and slow economic recovery, these markets have maintained their occupancy levels above 90%, says Hargrave. “While they might not be showing the biggest gains right now, they are also the ones that haven’t shown the sorts of occupancy deterioration like Phoenix.”

