
The volume of CMBS conduit loans liquidated in February retreated sharply, falling 43 percent from January's reading, according to real estate research firm Trepp LCC. The February reading was the lowest total since November 2010.
At $893 million, Trepp reported that liquidations were about 32 percent below the 12-month moving average of $1.31 billion per month. Since the beginning of 2010, the special servicers have been liquidating at an average rate of about $1.08 billion per month.
In February, liquidations came from 93 loans. This compares to 168 loans that were liquidated in January. The 12-month moving average is 151 loans per month.
The average loan size for liquidated loans was $9.6 million in February. Over the last 12 months, the average size of liquidated loans has been $8.7 million.
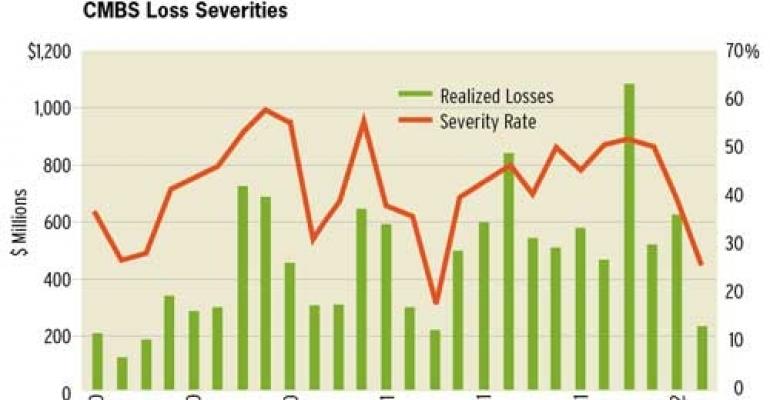
The losses in February amounted to $228 million—representing an average loss severity of 25.55 percent. This was down by more than 14 points from January's 39.54 percent reading. February represented the lowest severity level since March 2011 and is below the 12-month rolling average of 42.27 percent.
However Trepp did point out that taking loans with losses of less than two percent reveals a different picture. The firm wrote, “As we've noted before, we suspect that in many cases, the small loss loans are actually refinancings that have taken place where the losses reflect small, unpaid special servicer fees or other costs.”
After subtracting these “small loss” loans, there were $560 million in liquidations in February. That volume was a 52 percent drop from January and is below the monthly average of $1.05 billion in the past 12 months.
Looking at that pool, the average loss severity on this basis was 40.07 percent. That’s down 13 points from January's reading and below the 52.87 percent average monthly rate over the last 12 months.
Property breakdown
Trepp also released data by property type, which shows that over the last 26 months, retail has accounted for the most loans and highest balance liquidated, 1,153 loans and $7.93 billion respectively. Within that, there have been $3.8 billion in realized losses for a loss severity rate of 48.31 percent.

The office sector has had 740 loans liquidated with a dollar value of $7.8 billion. There have been $2.9 billion in realized losses, for a severity rate of 37.29 percent. The multifamily sector has had 914 loans liquidated worth $6.8 billion. There have been $2.8 billion in realized losses for a severity rate of 41.32 percent.
The lodging sector has seen 273 loans liquidated for a total of $2.8 billion. There have been $1.3 billion in realized losses for a severity rate of 47.43 percent. Lastly, the industrial sector has had 246 loans liquidated worth $1.5 billion. Of that, $599.7 million has been realized in losses for a severity rate of 41.19 percent.
When subtracting pools with less than 2 percent loss rates, the loss severity rates by sector over the last 26 months stand at 58.25 percent for retail, 49.85 percent for office, 53.93 percent for multifamily, 58.27 percent for lodging and 55.62 percent for industrial.