

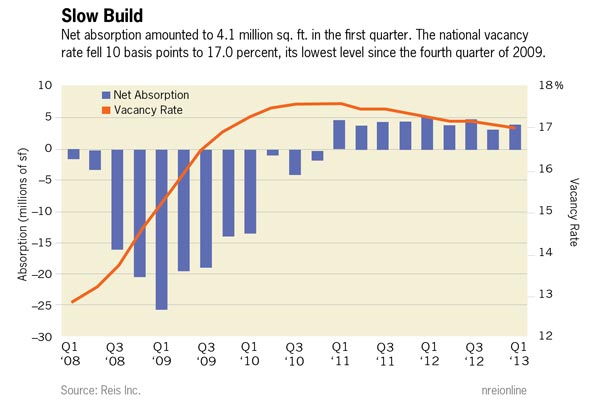
The national office vacancy rate declined by 10 basis points during the first quarter to 17 percent, marking exactly the same pace as the decline recorded in the prior quarter. If demand for office space was more robust, vacancies would be declining at a much faster pace since supply additions are virtually nil (more on this below).
National vacancies remain 450 basis points above the sector’s cyclical low, recorded in the third quarter of 2007. None of these results offer a major surprise, given recent trends in job growth. Job creation improved from 2010 to 2012, rising from about 85,000 per month in 2010 to over 182,000 per month in 2012, but that is barely enough to sustain demand for office space.
Construction Falls to Record Low
Occupied stock rose by only 4.096 million square feet in the first quarter, also at roughly the same anemic pace as in the prior quarter. Given high vacancy rates and lenders who are still skittish about committing large amounts of money to construction financing, it is hard to justify breaking ground on new office projects. Only 1.697 million square feet of new office space came online in the first quarter of 2013, the lowest quarterly figure for new completions since Reis began publishing quarterly data in 1999.
Asking and effective rents both grew by 0.7 percent during the first quarter. While this represents a slight slowdown from the prior quarter’s growth rate of 0.8 percent for both asking and effective rents, it is well above the quarterly average of about 0.4 percent since rents began rising consistently in the fourth quarter of 2010. Despite 10 consecutive quarters of rent increases, rent levels are still anchored at benchmarks last observed in late 2007.
A Metro-Level Perspective
Middling national numbers are driven by market-level figures that are split in half, with some metros recording improvements in occupancy (40 out of 82) and the rest showing declines.
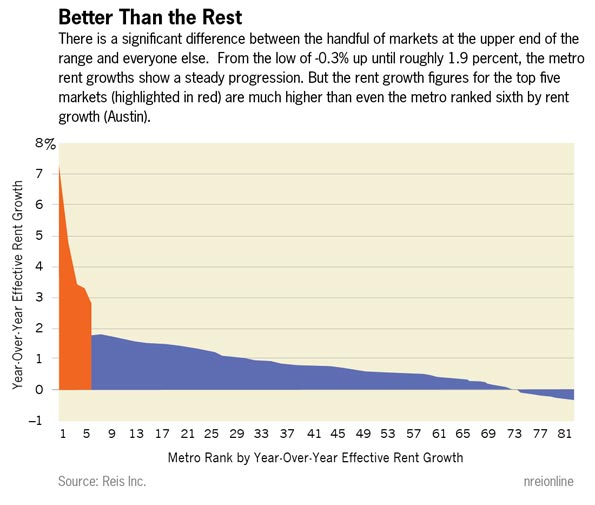
There is a small group of superstars. San Francisco, New York, San Jose and a handful of Texas markets led the way this quarter in terms of increases in effective rents; this comes as no surprise given that tech- and energy-reliant markets have been outperforming the national average despite overall moribund trends in the office sector. The same markets are on top of the rankings for year-over-year changes for both asking and effective rent growth.
The somewhat decent quarterly rent hikes the past two quarters were driven mostly by the performance of this handful of top markets. For example, the year-over-year effective rent growths at the metro level range from a high of 7.3 percent in San Francisco to a low of -0.3 percent in Fort Lauderdale, Fla. However, as you can see in the chart below, there is a significant difference between the handful of markets at the upper end of the range and everything else. From the low of -0.3 percent until roughly 1.9 percent, the metro rent growths show a steady progression. But the rent growth figures for the top five markets (highlighted in red) are much higher than even the metro ranked sixth by rent growth (Austin). Without the strength of the top five markets, the national year-ever-year effective rent growth would be cut in half.
The outlook for the tightest market in the country, however, is not as bright as for the markets identified above. Washington, DC remains the tightest market in terms of vacancy rates, coming in at 9.5 percent for the first quarter of 2013. However, it is likely that Washington and neighboring markets will have to contend with depressed demand in the near term, as sequestration proceedings hit government and related businesses in the area. Washington’s vacancy rate rose by 20 basis points this quarter (suburban Virginia/Northern Virginia’s vacancy also rose by 20 basis points, to 15.9 percent). Suburban Maryland’s vacancy rate remained flat, at 14.9 percent. Effective rent growth is still positive for the quarter, but falls somewhere in the middle to lower half of national rankings (Washington, at 0.5 percent, is at number 25 out of 82; suburban Virginia, at 0.4 percent, is at number 31. Suburban Maryland barely eked out a gain at 0.1 percent and is at number 67).
The Near-Term Outlook: Jobs, Jobs, Jobs
While different metros will experience their own ups and downs, broad-based job growth will still be the key to seeing a nation-wide recovery in office space fundamentals. On the bright side, the latest job report offered a glimmer of hope for the labor market. April’s job figures came in above expectations at roughly165,000. While this isn’t exactly break neck pace, the revisions to the prior month helped buoy spirits. March’s very weak payroll additions were revised up by 50,000, while February’s total was revised up to a strong 332,000. Moreover, gains in business/professional services were the primary driver of April’s job gains, which is a plus for office building owners.
Still, a marked acceleration in job gains is unlikely. Reis expects a slight improvement in payroll gains for 2013, averaging 190,000 per month, with much of the stronger hiring coming in the latter half of the year. We may see an increase in office leasing activity later in the year, but the pace of vacancy declines and improvements in occupied stock and rent levels is likely to remain unimpressive.
Brad Doremus is senior analyst,and Victor Calanog is head of research and economics, for New York-based research firm Reis.